CInsightC
CInsightC helps you in monitoring Clarity and increase the availability and performance. To do so, it measures Clarity at several important checkpoints. The results are stored in the Clarity database. Go to the
Download Page to download the software.
Lite Edition
The Lite Edition is freeware. No support included. It is possible to get support on this edition.
Enterprise Edition
The Enterprise Edition is a version where a Software License is needed. Contact sales@tempusverus.com for licensing details. Tool Support on CInsightC is included, based on a monthly fee. This edition is recommended for al major Clarity sites. CInsightC On-site Tool Support is only available in Europe.
Support is available for the Windows and AIX platform. Both Oracle and MSSQL databases are supported.
Features
Error Logging
Error Logging reads the Application and Background logfiles of Clarity and stores all the loglines in a table in the database. This gives a clear overview of all the data being written to the Clarity logfiles at any time. Once a logfile entry is written to the database, it will not be deleted. This gives some historical statistics in the origin of errors.
The loglines written to the database are having enough metadata like timestamp in milliseconds, name of the originating logfile, severity, etc. This gives the opportunity to do thorough analysis with regards to incidents.
GC Logging
GC Logging stands for Garbage Collection Logging. In short terms, Garbage Collection is an internal java routine to delete all unrelated / unused memory objects. The statistics of this Garbage Collection Routine can be written to a GC Logfile. This GC Logfile can be interpreted by CinsightC as well. This data gives the single most important impression about usage and load of the Clarity system. By analysing these statistics, situations like OutOfMemory and other crashes can be predicted and prevented.
Uptime Statistics
CInsightC is able to measure the availability of Clarity and the related database. These statistics are also stored in the database. Besides the real availability figures of Clarity it gives the opportunity to use this data for recognition of an pattern of unavailability.
- Example 1: database administrators have the bad habit to restart database without notifying the Clarity administrators. CInsightC detects this immediately and stores the results of the database probing in a csv-file (since the database is unavailable, it must be stored elsewhere).
- Example 2: Clarity is always crashing after 4 pm on certain days. The statistics of CInsightC gives more information and it is possible to see it is always on the first wednesday of the month. By having this indicator, it is possible to relate the crash to an user which generates extra load on the Clarity system by generating monthly reports. By optimizing the monthly reports, the crashes are avoided.
Email Notifications
CInsightC is able to send emailnotifications to an unlimited customizable list of administrators. CinsightC will send an email when either Clarity or the Database is unavailable or when one of these doesn't have finished the probing action within 5 seconds (which is classified as an extreme delay).
CInsightC will also send an emailnotification to an unlimited customizable list of administrators based on a list of keywords. If one of these keywords occurs in the logfile, the administrators will be notified. This enables the administrators to take immediately action when eg. an OutOfMemory message is written to the Clarity logfile, or a certain Oracle Message (ORA-{code}).
Session Statistics
CInsightC is able to detect all the user-sessions of Clarity and to relate them to one of the Clarity instances in case of a Cluster Setup. When there are issues in Clarity, it is possible to detect the affected users and to inform them. The session statistics data is also stored in the database tables of CInsightC, these will keep the usage of Clarity stored. This information can be used for numerous appliances.
Note: there is a small customisation needed for this functionality.
Portlets
To be able to analyze all the statistics, some free portlets are provided. This is a list of available reports:
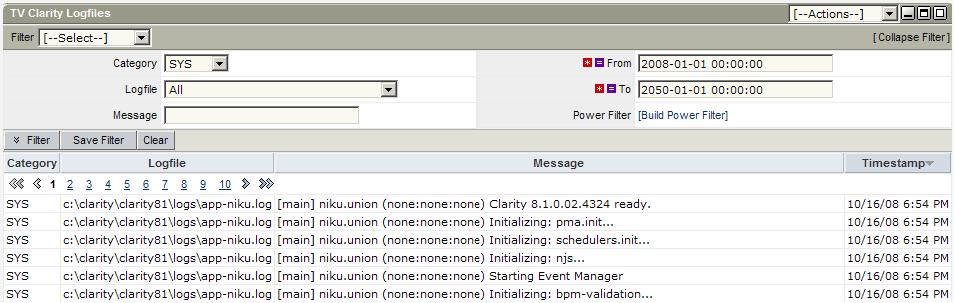
- TV Clarity Logfiles;
- TV Background Logfiles;
- TV Access Logs (Enterprise);
- TV Access Logs Graph (Enterprise);
- TV Access Logs Graph V2 (Enterprise);
- TV Access Logs V3 (Enterprise)
- TV Access Logs Bar Graph V4 (Enterprise);
- TV GC Logging;
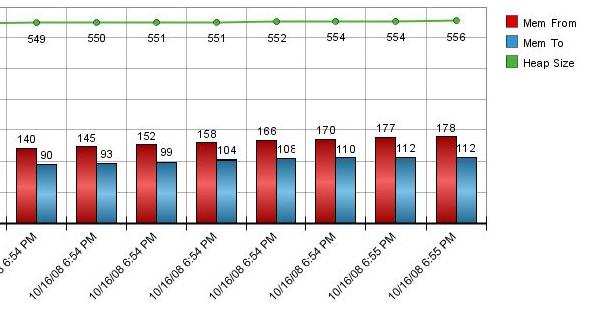
- TV GC Graph;
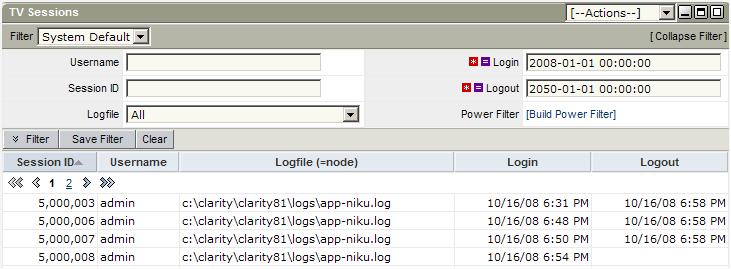
- TV Sessions (Enterprise);
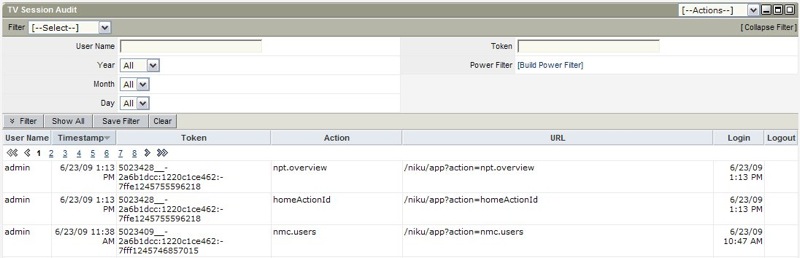
- TV Session Audit (Enterprise);
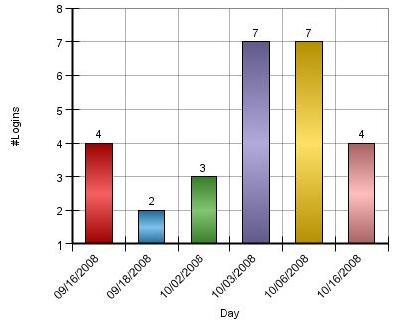
- TV Logins Graph;
- TV Perf Hour View (Enterprise);
- TV Uptime Log;
- TV Uptime Graph;
- TV Monitor;
Lots of filtering possibilities are available to narrow the scope of data to only a couple of miliseconds or to certain keywords if needed.
- Screenshot 'TV Logins (graph)':
- Screenshot 'TV Sessions':
- Screenshot 'TV GC (graph)':
- Screenshot 'TV Clarity Logfiles':
- Screenshot 'TV Access Logfiles':
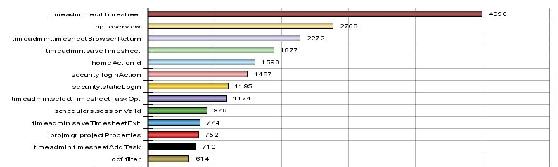
Access Logs
CInsightC is also equiped to read and interprete the Clarity Access Loggings. This gives information on which parts of Clarity are actually used at what time. All Access Log entries are optionally related to the associated sessionid of the Clarity user. This enables you to track user sessions and analyze them if needed.
- Screenshot 'TV Session Audit (graph)':
Monitoring Website
The monitoring website displays all the facts and statistics generated by the CInsightC engine. This can be needed when Clarity is not available, but when the information of CInsightC is needed, eg. to analyze a crash. The monitoring website is using a custom Apache Tomcat installation.
Performance Statistics
Note: this functionality is not available yet.
CInsightC is measuring the performance of Clarity on several points. It creates a Clarity Session, gets some pages and saves the responsetimes in the CInsightC tables.
Performance Statistics
Windows Only: CInsightC measures CPU and Memory statistics of your application servers. Measuring points are (per machine):
- Percentage Processor Time
- System Up Time
- Available MB Memory
- Total Physical Memory
Planned functionality:
CInsightC is measuring the performance of Clarity on several points. It creates a Clarity Session, gets some pages and saves the responsetimes in the CInsightC tables.
Database Health
Note: this functionality is not available yet.
CInsightC retrieves certain statistics from the database and saves it to the CInsightC tables. These statistics can be used for optimalisation of the database subsystem.
Note: Oracle only.


